Introducing GPU Profilers
GPPT Workshop
2026-09-15
GPU Profilers
What is a profiler?
- A tool that runs a command or program, and collects data and metrics about its performance.
- Event records are collected through hardware counters, and provide performance information including:
- Timing, hardware utilisation, instructions, call hierarchy and more.
- This presented information can then be used to engineer better performance from our code.
How does a profiler collect data?
Types of data collection:
Sampling
- At a chosen frequency, query the hardware for usage.
- Lightweight and fast.
- Requires no changes to the source code.
- Default for the profilers we will use today.
Instrumented
- Adding code or hooks to a program to record specific metrics.
- More in-depth collection and specific targeting possible.
- Introduces larger overheads during operation.
- Can be requested of our profilers.
Today, we will only use sampled profiling.
Profiling vs Benchmarking
Related but distinct concepts that sometimes get used interchangeably. Both measure performance of code, but with different goals.
Profiling
Measuring performance metrics with the aim of understanding how the code works, and ultimately optimise performance.
Benchmarking
Measures the performance of existing code.
Useful for comparing code on different hardwares, or testing the scaling of our programs.
What types of profiler are available for GPU?
Systems
Profiles the complete operation of the program from start to finish
Highlights
- Program timeline
- Data transfers
- Kernel overheads and runtimes
Compute
Provides detailed information about the individual kernels
Highlights
- GPU occupancy
- Throughputs
- Memory usage metrics
How do we use profilers to optimise?
Run profiler on workflow
Implement optimisations
Check profiler outputs for optimisation strategies
Nvidia’s Nsight profilers



Nsight Systems
Nsight Compute
Nsight Systems
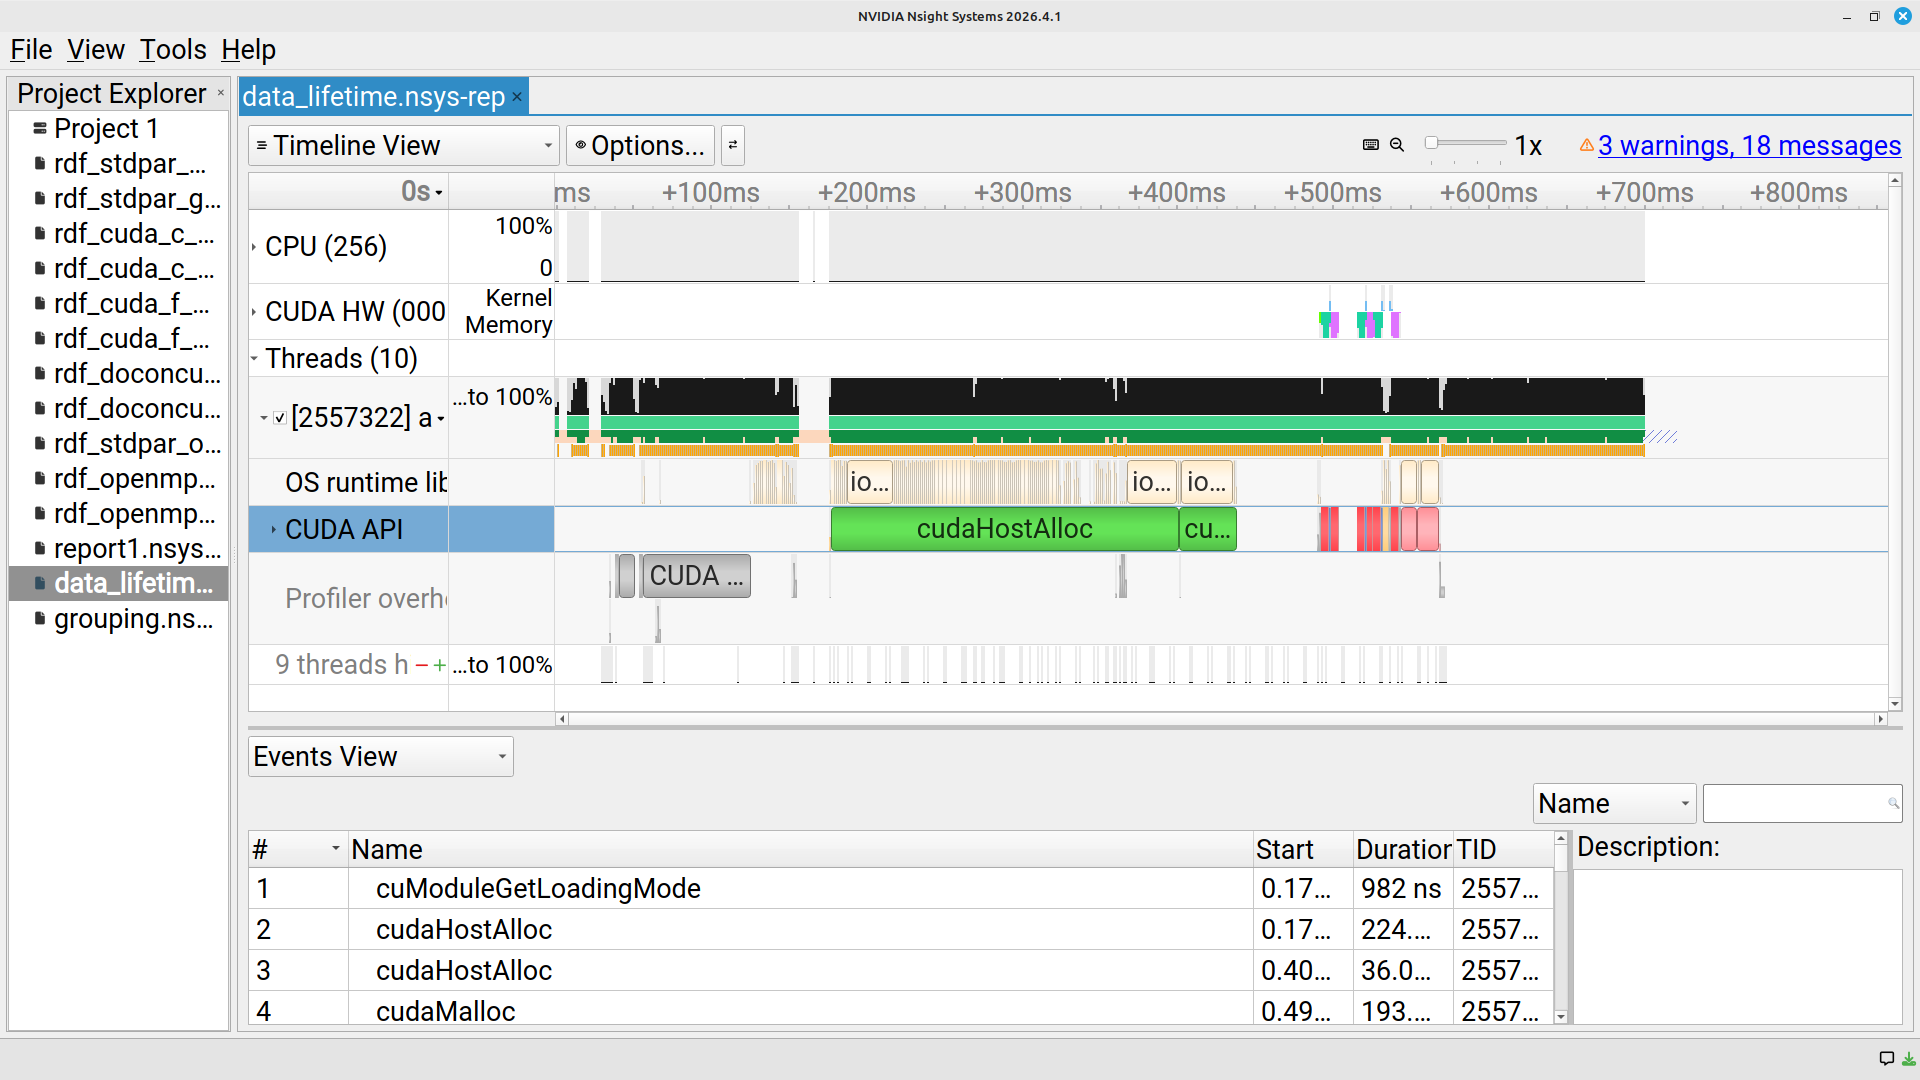
Running Nsight Systems
Command line
Practical time! (10 minutes)
Run Nsight Systems on the provided code!
Tasks:
- Familiarise yourself with the timeline view.
- Use the CUDA HW track to identify where the GPU is carrying out work.
- Use the CUDA API track check which CUDA functions are being called.
Record in the shared document the order and time taken of actions on the device.

Using Nsight Systems
- Shows run times, data transfers and kernel overheads.
- First port of call for sanity checking programs.
- Graphical representation of the code’s running.
- Timeline helps quickly spot if something is obviously wrong;
- Many data transfers,
- Long-running kernels.
- Identifying longer kernels, or kernels that are called a lot, can provide potential optimisation targets
Nsight Compute
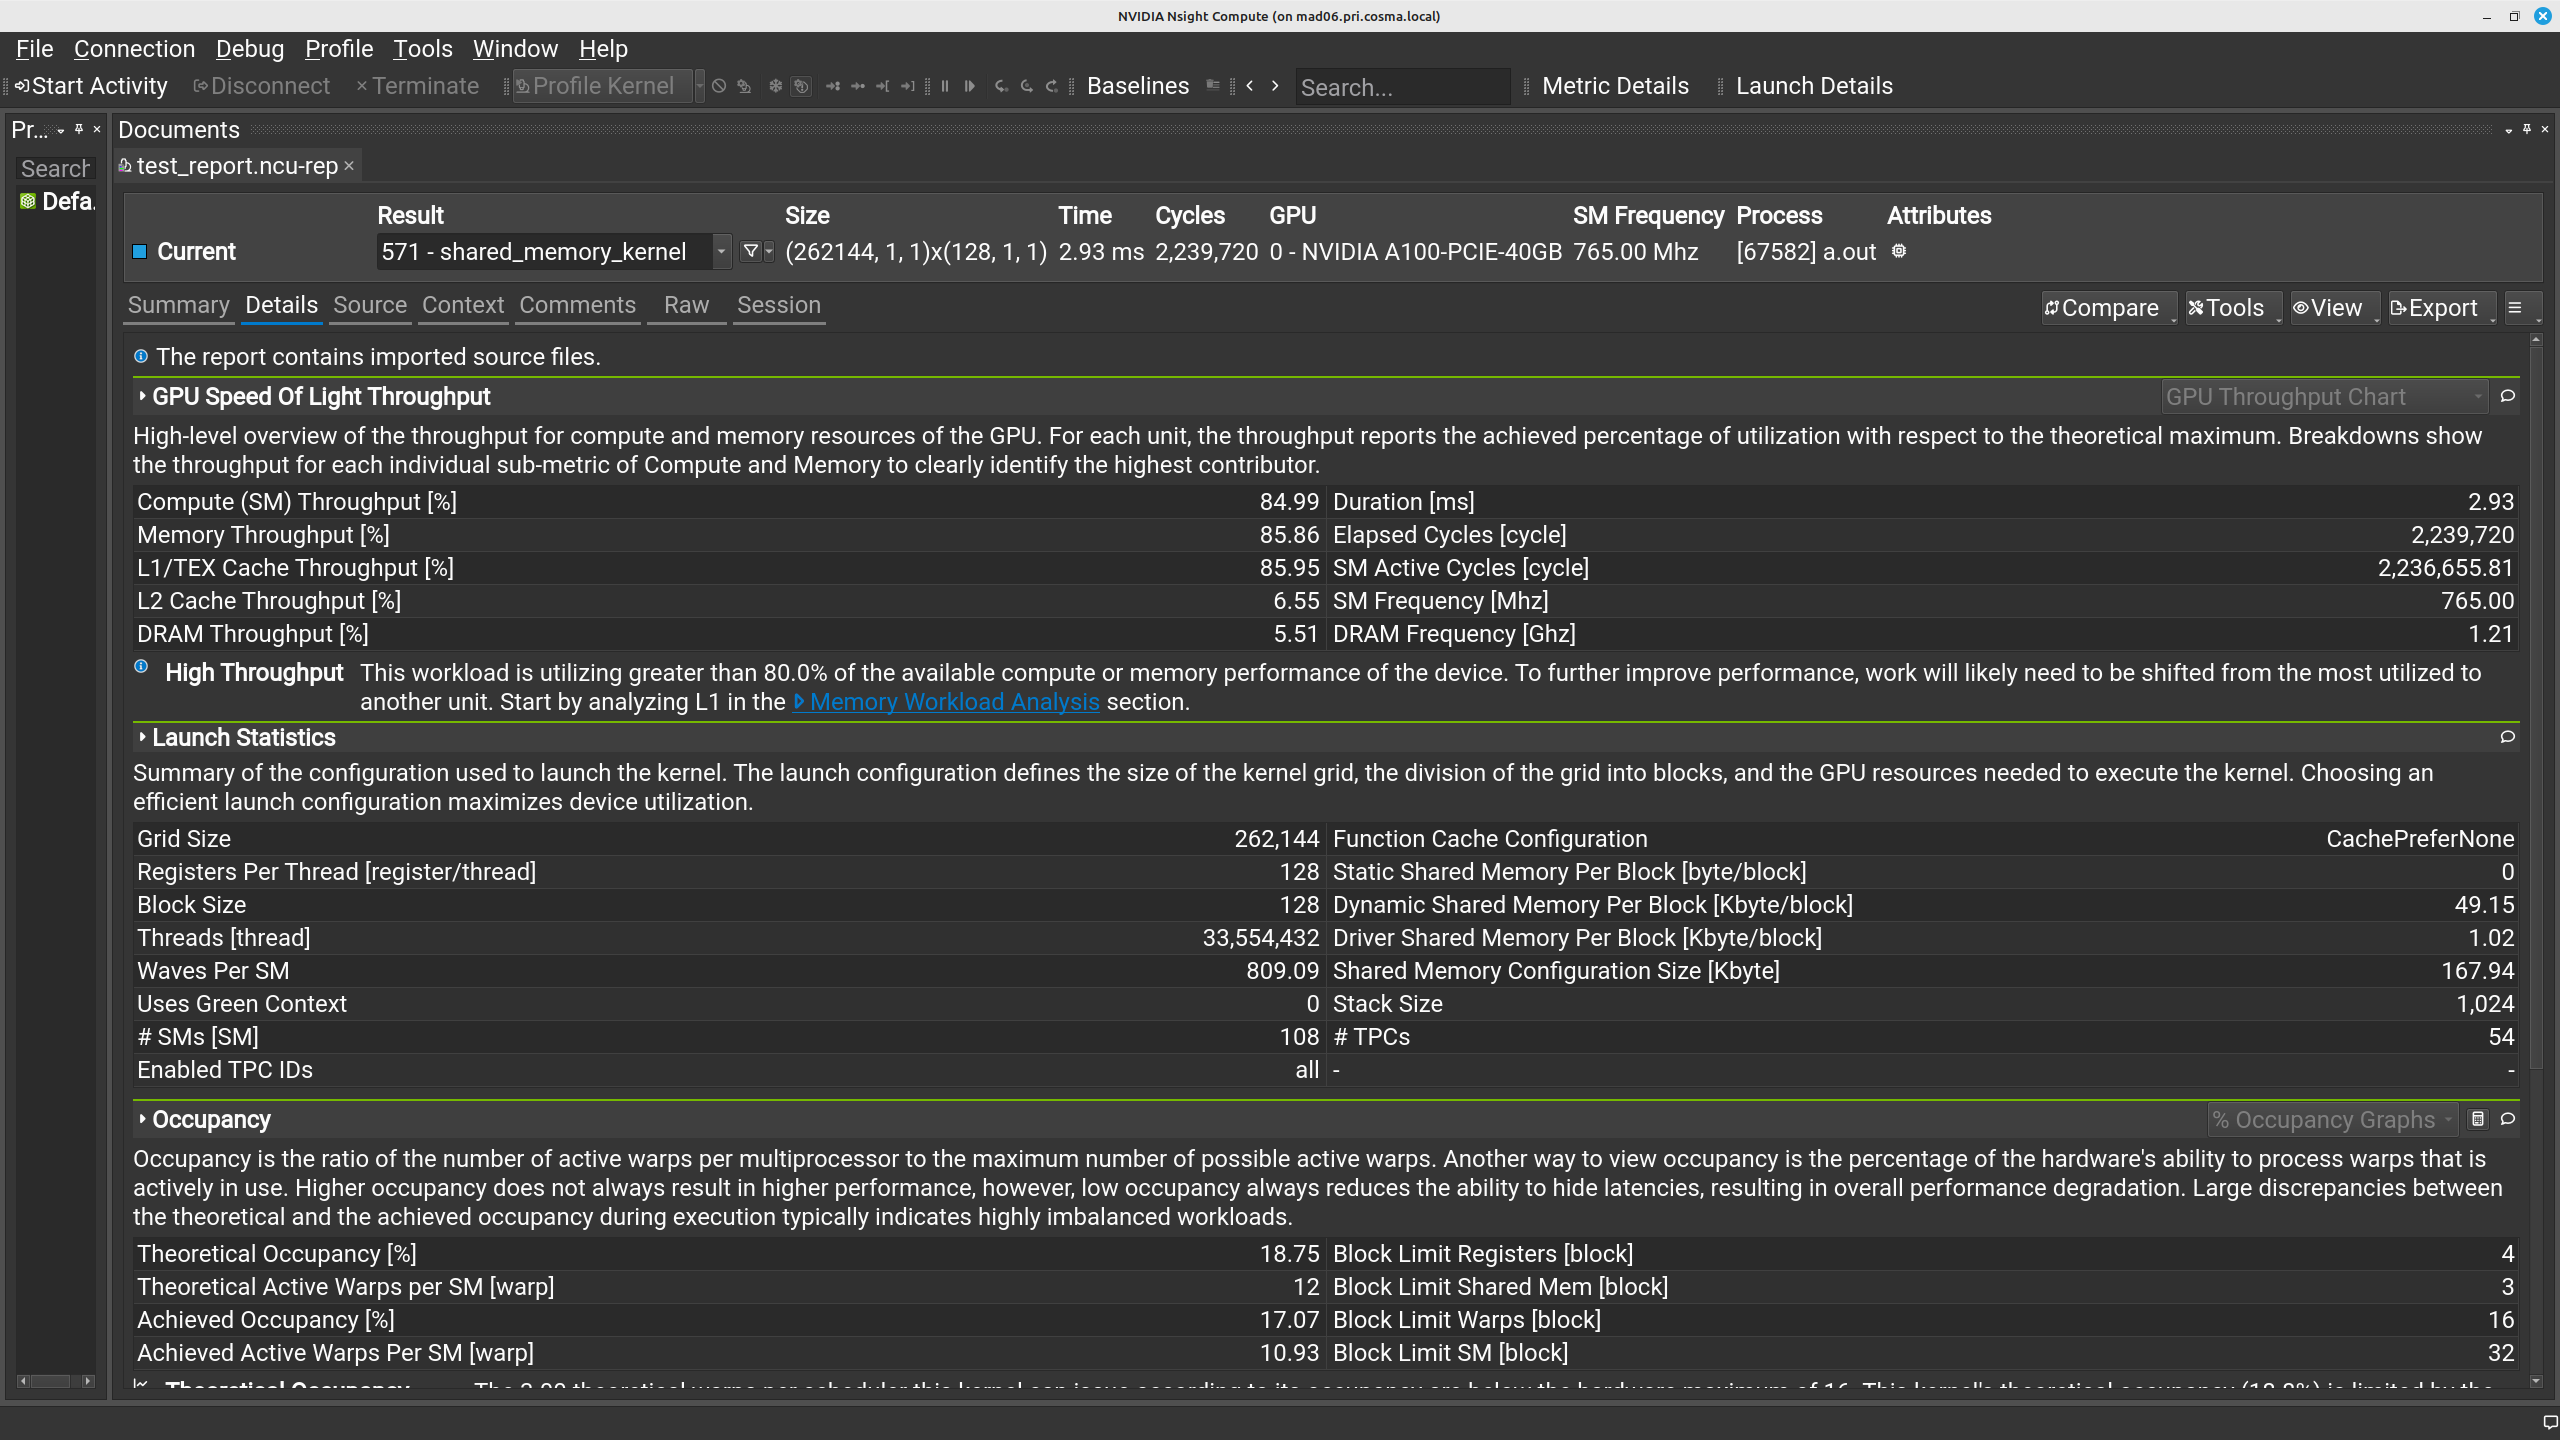
Using Nsight Compute
Command line
Exercise: Run Nsight Compute through CLI (5 mins)
Use Nsight Compute on the same code.
-k here tells the profiler to run only on the desired kernels.
Make sure the command runs, and take a look at the output. Write down the kernel’s execution time in the shared document.
Using Nsight Compute
Important concepts you should have seen:
- Compute and memory throughputs
- Launch parameters
- Occupancy
Additional information available in the GUI:
- Source view, instructions and compute resources
Note: The profiler offers hints on improving performance.
Compute concepts: Speed of Light Throughput
    ----------------------- ----------- ----------------
    Metric Name             Metric Unit     Metric Value
    ----------------------- ----------- ----------------
    DRAM Frequency                  Ghz             1.21
    SM Frequency                    Mhz           765.00
    Elapsed Cycles                cycle    1,428,679,972
    Memory Throughput                 %            84.59
    DRAM Throughput                   %            84.59
    Duration                          s             1.87
    L1/TEX Cache Throughput           %            21.85
    L2 Cache Throughput               %            86.27
    SM Active Cycles              cycle 1,428,575,871.03
    Compute (SM) Throughput           %             6.75
    ----------------------- ----------- ----------------
Memory and compute usage of the resource as a ratio against the maximum possible of the hardware
Compute concepts: Speed of Light Throughput
    ----------------------- ----------- ----------------
    Metric Name             Metric Unit     Metric Value
    ----------------------- ----------- ----------------
    DRAM Frequency                  Ghz             1.21
    SM Frequency                    Mhz           765.00
    Elapsed Cycles                cycle    1,428,679,972
    Memory Throughput                 %            84.59
    DRAM Throughput                   %            84.59
    Duration                          s             1.87
    L1/TEX Cache Throughput           %            21.85
    L2 Cache Throughput               %            86.27
    SM Active Cycles              cycle 1,428,575,871.03
    Compute (SM) Throughput           %             6.75
    ----------------------- ----------- ----------------
How long the kernel took to run to completion
Compute concepts: Launch Statistics
    Section: Launch Statistics
    -------------------------------- --------------- ---------------
    Metric Name                          Metric Unit    Metric Value
    -------------------------------- --------------- ---------------
    Block Size                                                   256
    Function Cache Configuration                     CachePreferNone
    Grid Size                                                 16,384
    Registers Per Thread             register/thread              16
    Shared Memory Configuration Size           Kbyte           32.77
    Driver Shared Memory Per Block       Kbyte/block            1.02
    Dynamic Shared Memory Per Block       byte/block               0
    Static Shared Memory Per Block        byte/block               0
    # SMs                                         SM             108
    Stack Size                                                 1,024
    Threads                                   thread       4,194,304
    # TPCs                                                        54
    Enabled TPC IDs                                              all
    Uses Green Context                                             0
    Waves Per SM                                               18.96
    -------------------------------- --------------- ---------------
Compute concepts: Launch Statistics
    Section: Launch Statistics
    -------------------------------- --------------- ---------------
    Metric Name                          Metric Unit    Metric Value
    -------------------------------- --------------- ---------------
    Block Size                                                   256
    Function Cache Configuration                     CachePreferNone
    Grid Size                                                 16,384
    Registers Per Thread             register/thread              16
    Shared Memory Configuration Size           Kbyte           32.77
    Driver Shared Memory Per Block       Kbyte/block            1.02
    Dynamic Shared Memory Per Block       byte/block               0
    Static Shared Memory Per Block        byte/block               0
    # SMs                                         SM             108
    Stack Size                                                 1,024
    Threads                                   thread       4,194,304
    # TPCs                                                        54
    Enabled TPC IDs                                              all
    Uses Green Context                                             0
    Waves Per SM                                               18.96
    -------------------------------- --------------- ---------------
Grid dimensions (as defined by the launch parameters)
Compute concepts: Launch Statistics
    Section: Launch Statistics
    -------------------------------- --------------- ---------------
    Metric Name                          Metric Unit    Metric Value
    -------------------------------- --------------- ---------------
    Block Size                                                   256
    Function Cache Configuration                     CachePreferNone
    Grid Size                                                 16,384
    Registers Per Thread             register/thread              16
    Shared Memory Configuration Size           Kbyte           32.77
    Driver Shared Memory Per Block       Kbyte/block            1.02
    Dynamic Shared Memory Per Block       byte/block               0
    Static Shared Memory Per Block        byte/block               0
    # SMs                                         SM             108
    Stack Size                                                 1,024
    Threads                                   thread       4,194,304
    # TPCs                                                        54
    Enabled TPC IDs                                              all
    Uses Green Context                                             0
    Waves Per SM                                               18.96
    -------------------------------- --------------- ---------------
Number of registers that each thread uses (counted during kernel running)
Compute concepts: Launch Statistics
    Section: Launch Statistics
    -------------------------------- --------------- ---------------
    Metric Name                          Metric Unit    Metric Value
    -------------------------------- --------------- ---------------
    Block Size                                                   256
    Function Cache Configuration                     CachePreferNone
    Grid Size                                                 16,384
    Registers Per Thread             register/thread              16
    Shared Memory Configuration Size           Kbyte           32.77
    Driver Shared Memory Per Block       Kbyte/block            1.02
    Dynamic Shared Memory Per Block       byte/block               0
    Static Shared Memory Per Block        byte/block               0
    # SMs                                         SM             108
    Stack Size                                                 1,024
    Threads                                   thread       4,194,304
    # TPCs                                                        54
    Enabled TPC IDs                                              all
    Uses Green Context                                             0
    Waves Per SM                                               18.96
    -------------------------------- --------------- ---------------
Shared memory. From launch parameters and measured in use.
Compute concepts: Occupancy
The ratio of active warps to the theoretical maximum possible on the hardware.
    Section: Occupancy
    ------------------------------- ----------- ------------
    Metric Name                     Metric Unit Metric Value
    ------------------------------- ----------- ------------
    Block Limit SM                        block           32
    Block Limit Registers                 block           16
    Block Limit Shared Mem                block           32
    Block Limit Warps                     block            8
    Theoretical Active Warps per SM        warp           64
    Theoretical Occupancy                     %          100
    Achieved Occupancy                        %        64.83
    Achieved Active Warps Per SM           warp        41.49
    ------------------------------- ----------- ------------
Compute concepts: Occupancy
The ratio of active warps to the theoretical maximum possible on the hardware.
    Section: Occupancy
    ------------------------------- ----------- ------------
    Metric Name                     Metric Unit Metric Value
    ------------------------------- ----------- ------------
    Block Limit SM                        block           32
    Block Limit Registers                 block           16
    Block Limit Shared Mem                block           32
    Block Limit Warps                     block            8
    Theoretical Active Warps per SM        warp           64
    Theoretical Occupancy                     %          100
    Achieved Occupancy                        %        64.83
    Achieved Active Warps Per SM           warp        41.49
    ------------------------------- ----------- ------------
Theoretical = maximum possible given the properties of the kernel
Achieved = Real occupancy (given thread overheads etc.)
Compute concepts: Occupancy
The ratio of active warps to the theoretical maximum possible on the hardware.
    Section: Occupancy
    ------------------------------- ----------- ------------
    Metric Name                     Metric Unit Metric Value
    ------------------------------- ----------- ------------
    Block Limit SM                        block           32
    Block Limit Registers                 block           16
    Block Limit Shared Mem                block           32
    Block Limit Warps                     block            8
    Theoretical Active Warps per SM        warp           64
    Theoretical Occupancy                     %          100
    Achieved Occupancy                        %        64.83
    Achieved Active Warps Per SM           warp        41.49
    ------------------------------- ----------- ------------
Fixed hardware cap on the number of blocks an SM can hold
Compute concepts: Occupancy
The ratio of active warps to the theoretical maximum possible on the hardware.
    Section: Occupancy
    ------------------------------- ----------- ------------
    Metric Name                     Metric Unit Metric Value
    ------------------------------- ----------- ------------
    Block Limit SM                        block           32
    Block Limit Registers                 block           16
    Block Limit Shared Mem                block           32
    Block Limit Warps                     block            8
    Theoretical Active Warps per SM        warp           64
    Theoretical Occupancy                     %          100
    Achieved Occupancy                        %        64.83
    Achieved Active Warps Per SM           warp        41.49
    ------------------------------- ----------- ------------
The SM’s register file divided by the registers each block needs.
Compute concepts: Occupancy
The ratio of active warps to the theoretical maximum possible on the hardware.
    Section: Occupancy
    ------------------------------- ----------- ------------
    Metric Name                     Metric Unit Metric Value
    ------------------------------- ----------- ------------
    Block Limit SM                        block           32
    Block Limit Registers                 block           16
    Block Limit Shared Mem                block           32
    Block Limit Warps                     block            8
    Theoretical Active Warps per SM        warp           64
    Theoretical Occupancy                     %          100
    Achieved Occupancy                        %        64.83
    Achieved Active Warps Per SM           warp        41.49
    ------------------------------- ----------- ------------
The SM’s shared memory divided by the amount each block requests.
Compute concepts: Occupancy
The ratio of active warps to the theoretical maximum possible on the hardware.
    Section: Occupancy
    ------------------------------- ----------- ------------
    Metric Name                     Metric Unit Metric Value
    ------------------------------- ----------- ------------
    Block Limit SM                        block           32
    Block Limit Registers                 block           16
    Block Limit Shared Mem                block           32
    Block Limit Warps                     block            8
    Theoretical Active Warps per SM        warp           64
    Theoretical Occupancy                     %          100
    Achieved Occupancy                        %        64.83
    Achieved Active Warps Per SM           warp        41.49
    ------------------------------- ----------- ------------
The SM’s maximum number of warps divided by the warps per block.
Occupancy caveat
Generally, you should be aiming to maximise usage of the GPU.
Higher occupancy is not always higher performance!
Some lower occupancy scenarios that run more efficiently:
- Threads that require many registers but few memory accesses.
- Lower thread counts running on properly coalesced memory.
- Kernels that require a lot of shared memory.
Compute concepts: Memory workload
    Section: GPU and Memory Workload Distribution
    -------------------------- ----------- ------------
    Metric Name                Metric Unit Metric Value
    -------------------------- ----------- ------------
    Average DRAM Active Cycles       cycle    13,501.20
    Total DRAM Elapsed Cycles        cycle   39,540,736
    Average L1 Active Cycles         cycle   618,614.50
    Total L1 Elapsed Cycles          cycle   67,216,096
    Average L2 Active Cycles         cycle      194,794
    Total L2 Elapsed Cycles          cycle   48,816,560
    Average SM Active Cycles         cycle   618,614.50
    Total SM Elapsed Cycles          cycle   67,216,096
    Average SMSP Active Cycles       cycle   618,525.90
    Total SMSP Elapsed Cycles        cycle  268,864,384
    -------------------------- ----------- ------------
Displays the number of memory cycles for the kernel.
We won’t be using this information in the workshop.
Exercise: Playing with occupancy!
Reminder of the factors that impact occupancy:
- Hardware limits in the GPU,
- Grid and block size,
- Shared memory usage,
- Registers per thread.
We will now go through a set of exercises that demonstrate these factors.
Occupancy exercises (20 minutes)
1) Grid and block size
launch_param_sizedirectory – where you already are!
2) Register use per thread
registersdirectory
3) Shared memory per block
shared_memorydirectory
In each code, a single parameter controls the amount of resources the kernels use – check the README.md in each directory for more information!
Make a note of the parameters you test, and how they impact the runtime and occupancy.
Occupancy I: Grid and block size
On an A100, which has a maximum of 32 blocks per streaming multiprocessor, changing the block sizes of the example gives the following occupancies:
| Threads/block | Warps/block | Expected occupancy | What it shows |
|---|---|---|---|
| 32 | 1 | ~50% | capped by the 32-blocks-per-SM limit, not warps — small blocks hurt |
| 64 | 2 | ~100% | just enough warps per block to fill the 64 slots |
| 128 | 4 | ~100% | fewer, larger blocks, still 64 warps |
| 256 | 8 | ~100% | conventional full-occupancy case |
| 768 | 24 | ~75% | 64 is not divisible by 24, so only 2 blocks fit and 16 warp slots stay idle |
| 1024 | 32 | ~100% | 2 blocks of 32 warps fill all 64 slots |
Occupancy II: Registers
You should find that increasing N in the program decreases occupancy.
N |
Register/thread | Duration (ms) | Occupancy (%) |
|---|---|---|---|
| 2 | 16 | 159 | 100 |
| 8 | 44 | 290 | 62 |
| 50 | 206 | 321 | 12.5 |
Takeaways:
- The number of registers that will be used by a thread is often unintuitive.
- A profiler will measure the use directly, making it a valuable tool here.
Occupancy III: Shared Memory
Higher use of shared memory causes lower occupancy.
| SHARED_STRIDES | Memory size per block | Blocks/SM | A100 Occupancy |
|---|---|---|---|
| 96 | 49kB | 3 | 18.75% |
| 64 | 32kB | 4 | 25% |
| 32 | 16kB | 9 | 56.25% |
| 24 | 12kB | 12 | 75% |
| 20 | 10kB | 14 | 87.5% |
| 18 | 9kB | 16 | 100% |
Occupancy III: Shared Memory takeaways
- Useful when you need a lot of data re-use
- GPUs, unlike CPUs, are NOT good at caching memory.
- Loops can benefit from using shared memory when you would think L2 cache should be used
- Too much use will impact performance!
Source and instruction view
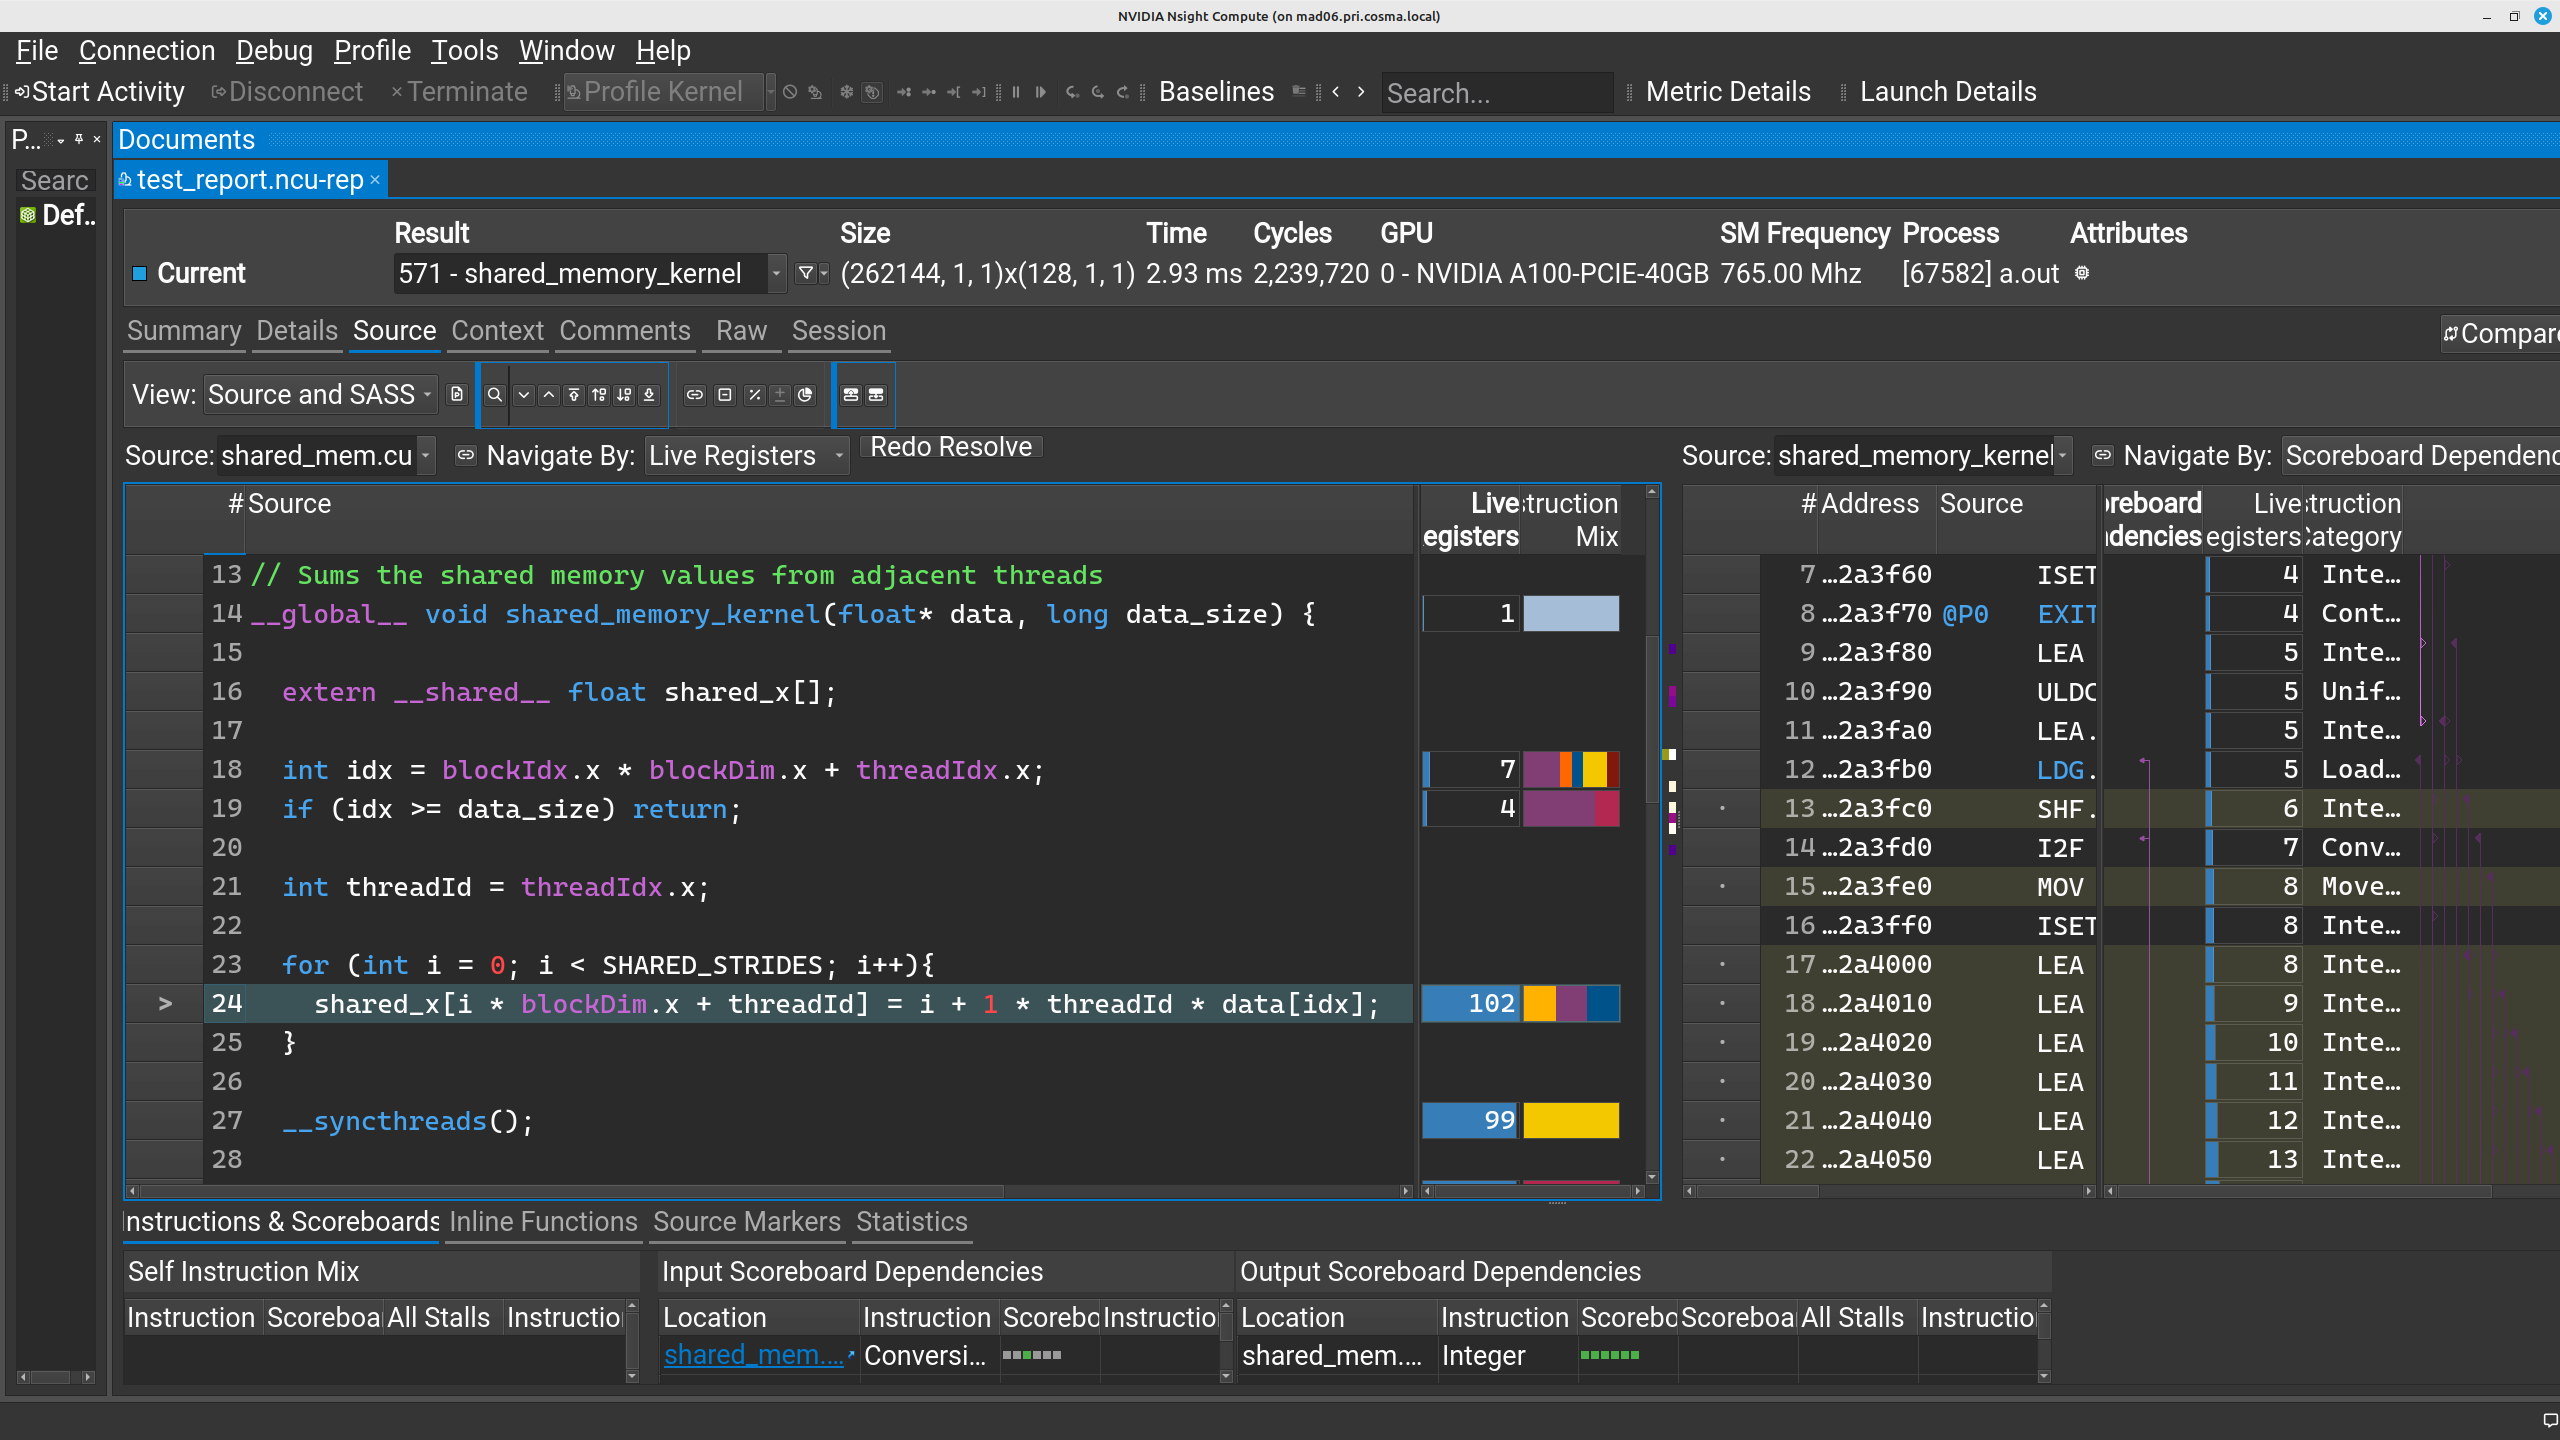
Profiling for performance
Interactive examples of some key concepts in performant GPU code.
The concepts we will be investigating:
- Memory coalescence
- Branching in kernels
- Minimising data transfers
Memory coalescence exercise (15 minutes)
Warps work most efficiently when each thread accesses sequential (‘coalesced’) memory.
To demonstrate this, we will profile the program in the indexing directory.
The program contains two kernels that perform summation operations on a 256 x 2^20 data structure. They perform the same amount of work, but with different memory access patterns:
row_sum_stridedaccesses its rows contiguously, in the manner that would be optimised for CPU.row_sum_coalesceduses a transposed indexing so that adjacent threads are accessing memory 1 float apart.
Memory coalescence discussion
| Kernel | duration (us) |
|---|---|
row_sum_strided |
3280 |
row_sum_coalesced |
764 |
The coalesced accesses are substantially faster.
Takeaways:
- Best practice is to design data to run well on the GPU from the start.
- It might be useful to spend time/compute to repack data into coalesced objects.
- Deciding which strategy is optimal is where the profiling cycling comes into its own!
Branching in kernels (15 minutes)
When threads in a warp take different branches in a kernel, the GPU runs both branches on every thread. A lot of branching in kernels can therefore hurt our performance.
Let’s look at a practical example, in the branching directory, which demonstrates this impact of branching on kernel run-time.
- Each thread in the
branching_kernelchoses a branch based on its ID and an input parameter - Changing the input parameter changes how coherent the warps are in branch selection.
- 1-31 = Divergent warps
- 32 = Coherent warps
Branching exercise discussion
| Coherence_parameter | Runtime (us) |
|---|---|
| 1 (divergent warps) | 813 |
| 16 | 813 |
| 32 (coherent warps) | 418 |
Takeaways:
- With divergent threads in the warp, the kernel runs each branch for every thread.
- When our warps coherently choose the same branch, we only need to run one of the branches, and our run time is halved.
- We can leverage this in the design of data structures and control paths, e.g. grouping boundary conditions together.
Minimising data transfers (30 minutes)
You have probably heard that data transfers between host and device are very costly to the performance of your code.
Now that you’re well-practiced in using a profiler, you can prove this for yourself!
There are two demonstrations of how data transfers can impact performance to explore:
1) Grouping transfers
- In the
grouping_transfersdirectory. - Demonstrates how runtime is impacted by splitting data transfers.
2) Avoiding additional transfers
- In the
data_lifetimedirectory. - Improve runtime using innefficient GPU code to avoid extra data transfers
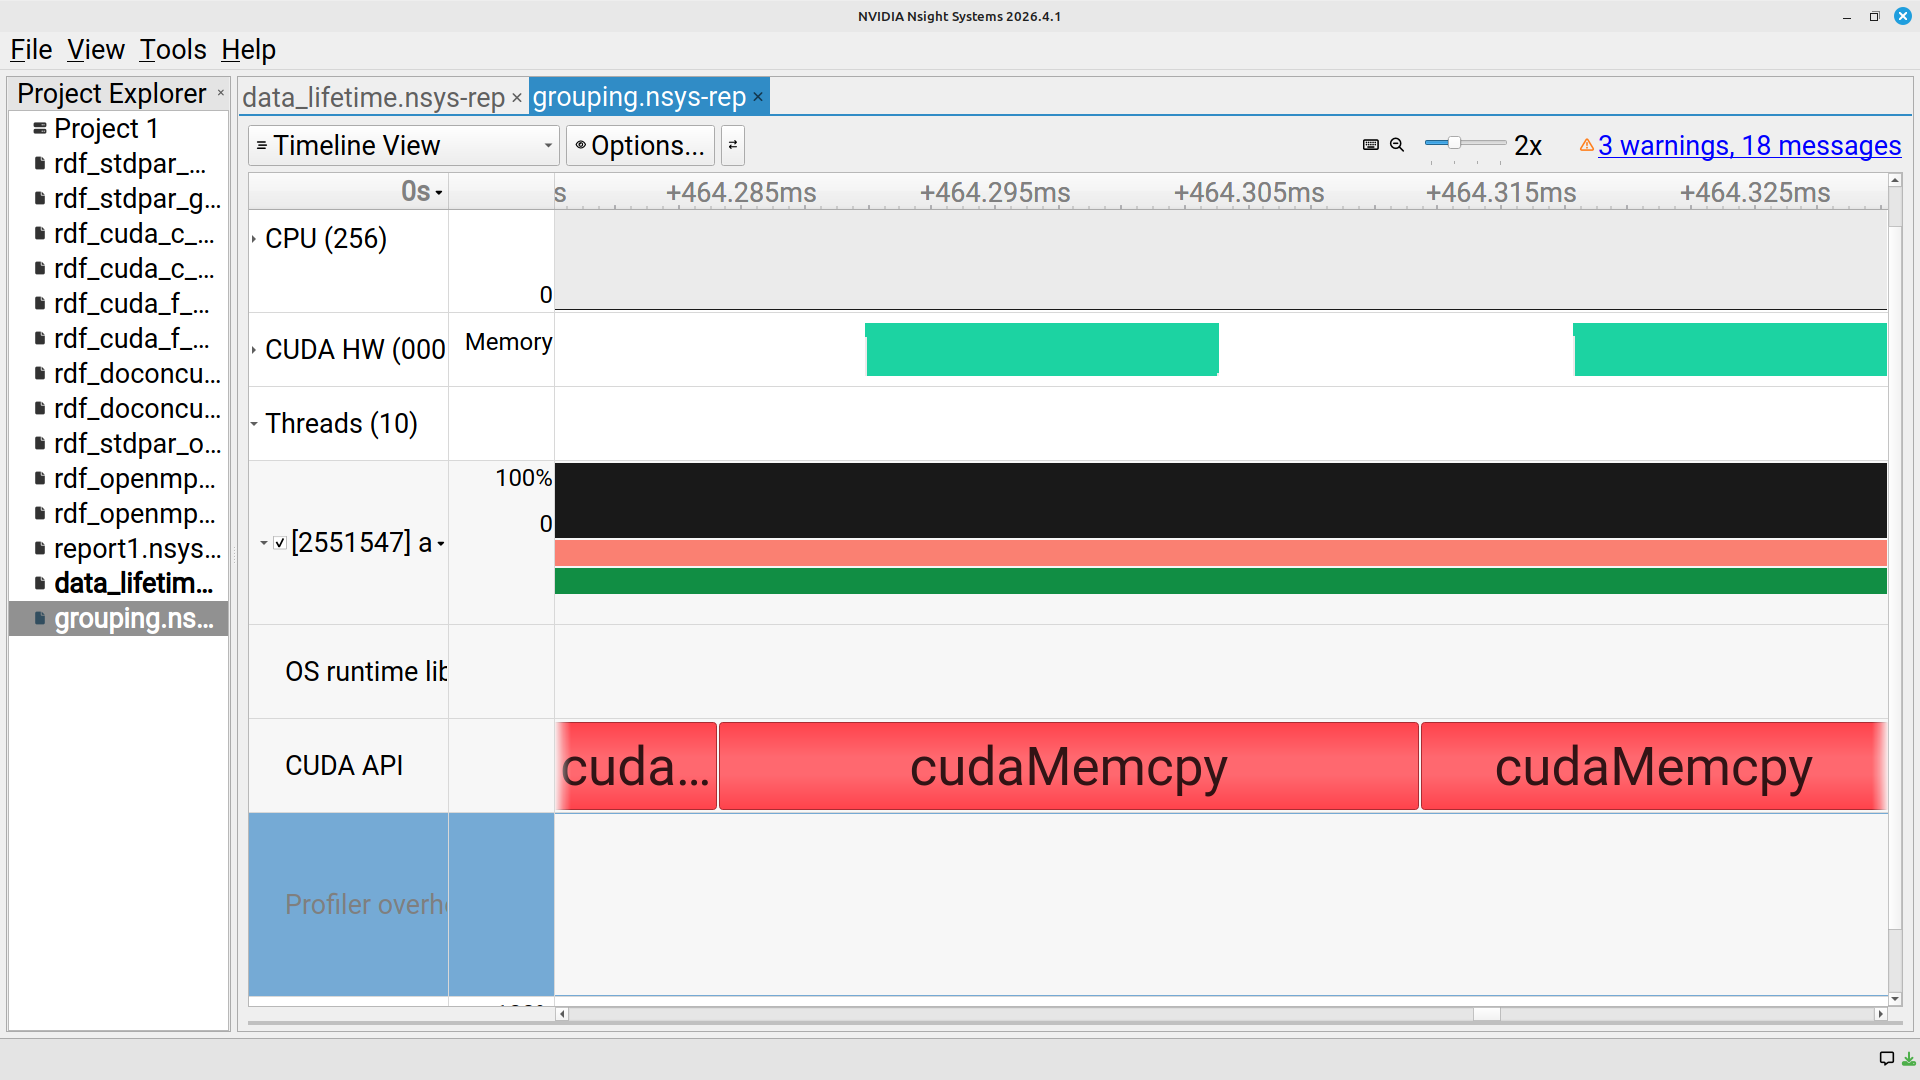
Grouped transfers I
Making one large transfer is more efficient than making many, smaller transfers.
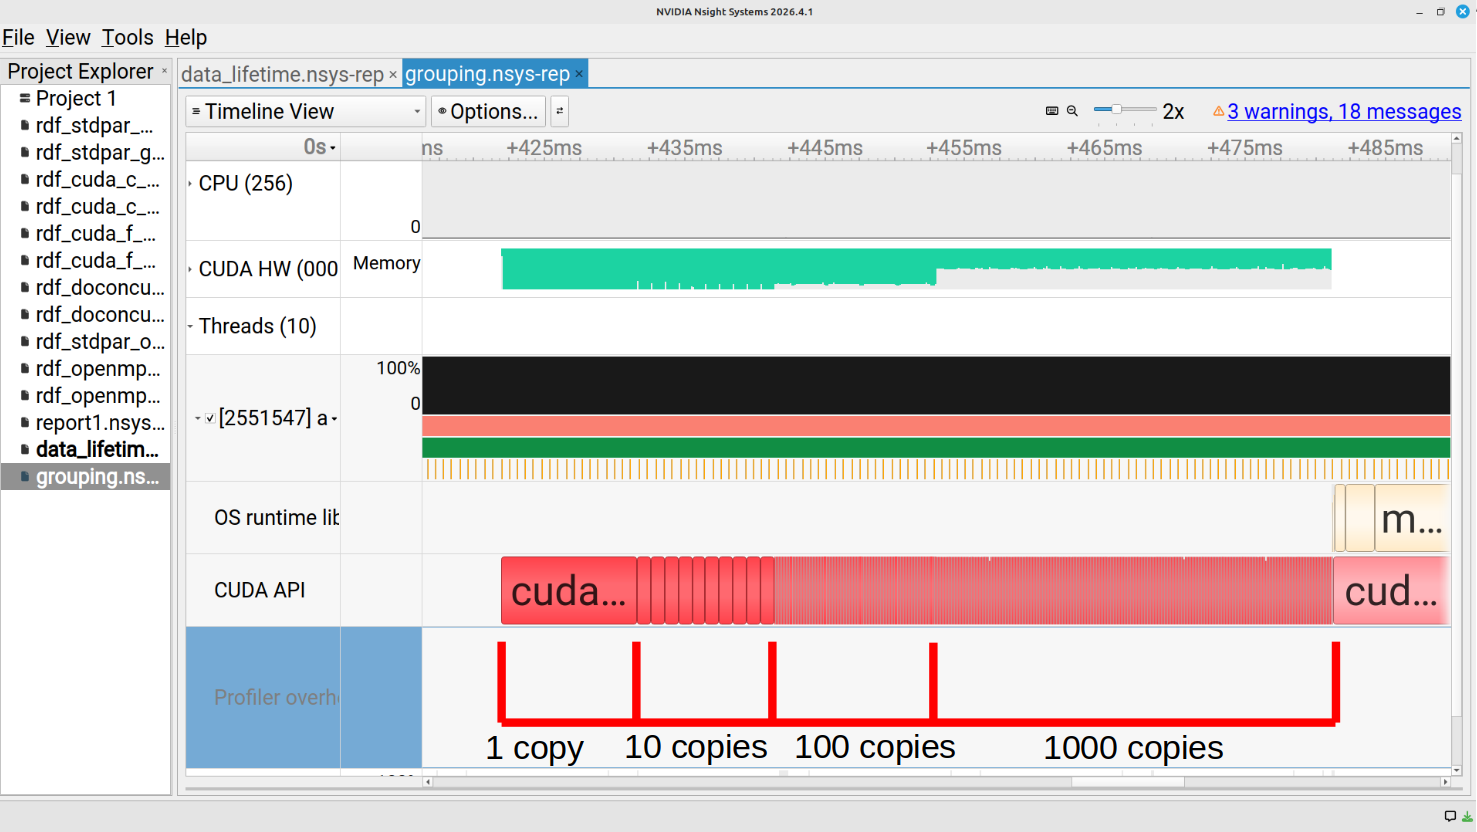
Grouped transfers II
Using the sqlite functionality of Systems we can produce a table that calculates the transfer overheads:
| bytes | calls | api (ns) | gpu (ns) | overhead (ns) |
|---|---|---|---|---|
| 128000 | 1000 | 27835646 | 13919100 | 13916546 |
| 1280000 | 100 | 11496019 | 10038196 | 1457823 |
| 12800000 | 10 | 9811789 | 9649268 | 162521 |
| 128000000 | 1 | 9663991 | 9612501 | 51490 |
Remember!
- The same overheads will also happen when launching kernels.
- Launching many small transfers (or kernels!) in a loop is a very good way to run into large overheads, slowing down your code!
Data lifetime
Because data transfers are very time-expensive, it is good practice to leave memory on the GPU for as long as possible.
Sometimes, this means creating kernels for code that could be better optimised on CPU but is part of the way through a GPU workflow. The inefficient calculations on GPU might still be faster than a transfer to and from the host!
Data lifetime exercise (15 minutes)
Consider the program in the data_lifetime directory.
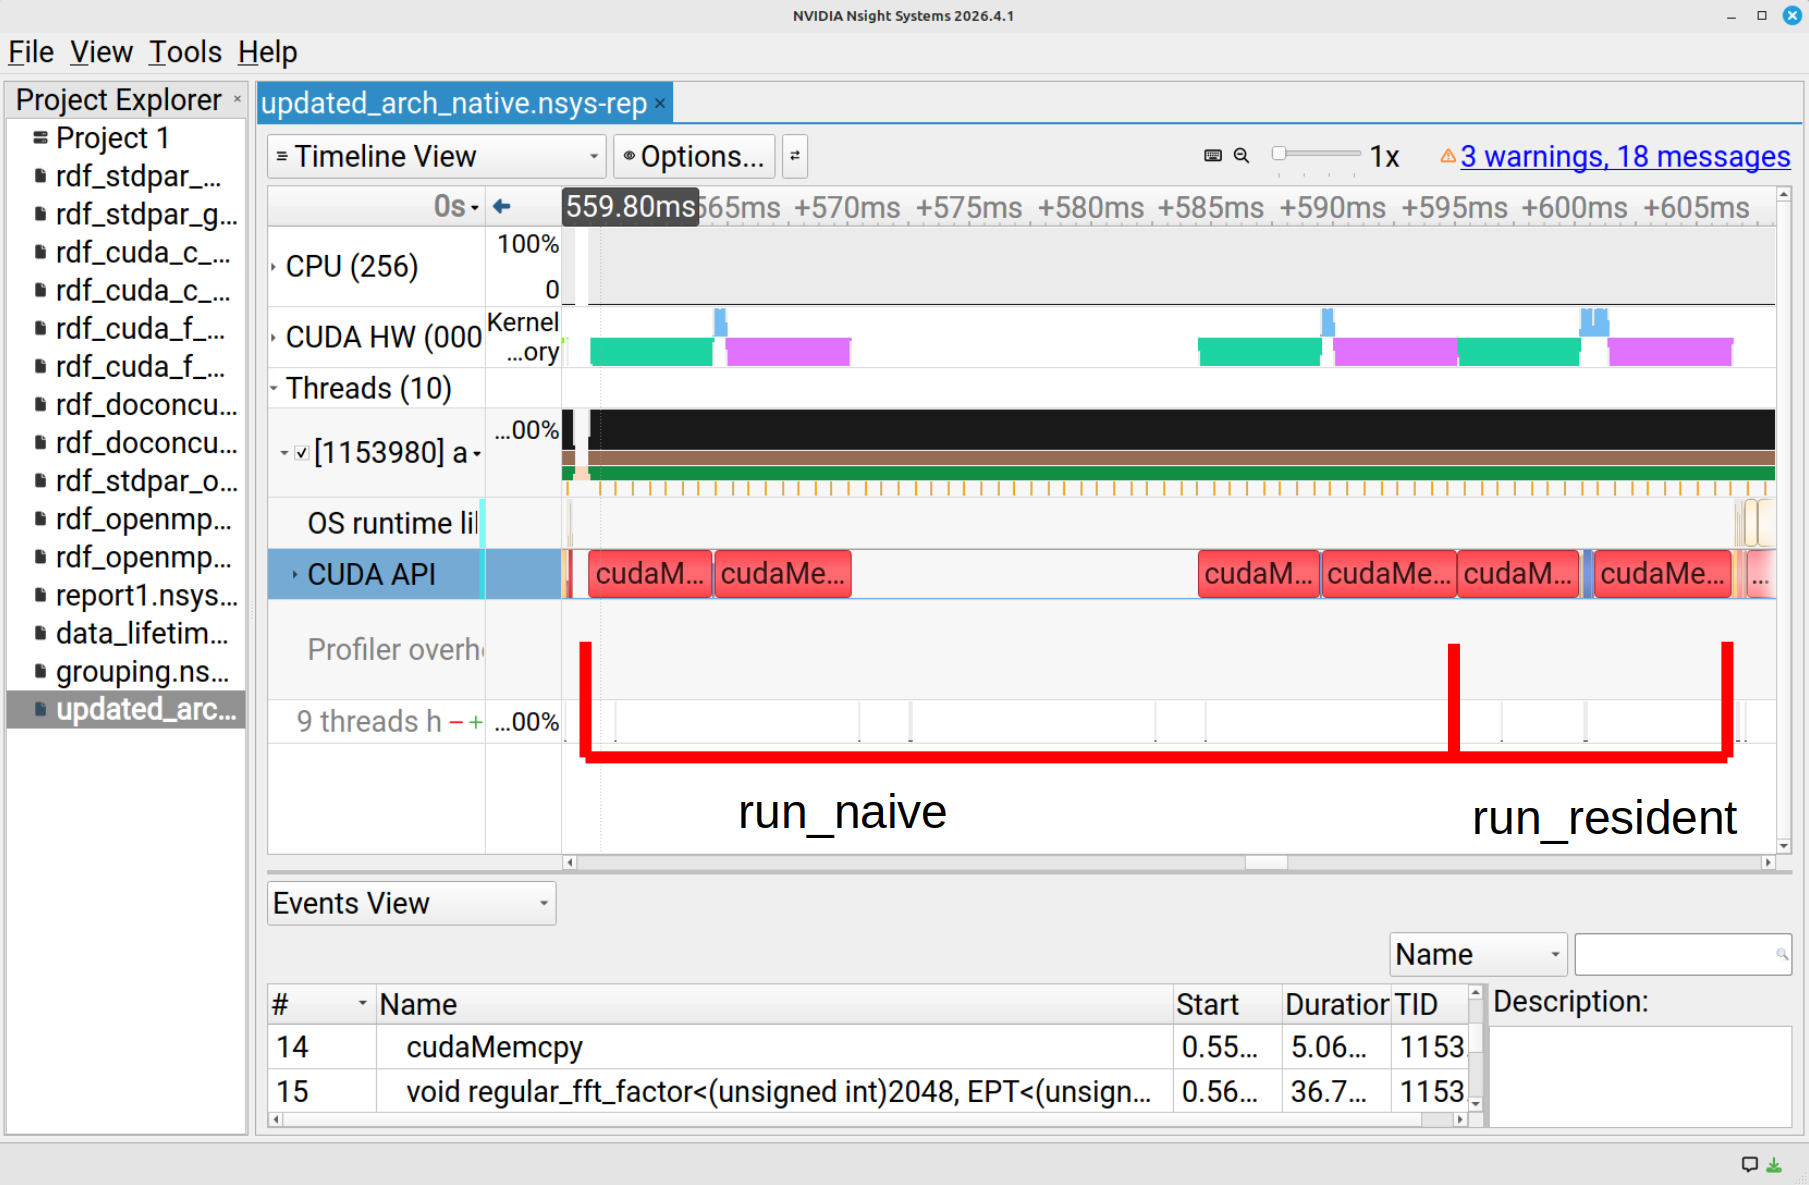
The workflow of the program is:
- Carry out a Fast Fourier Transform (FFT) on a large data object – well suited to GPU,
- Re-normalise the array – a task generally not worth offloading to GPU,
- Reverse the FFT – on the GPU.
Two versions of this workflow are presented:
run_naive, which transfers the data back to the CPU for the normalisation calculations,run_resident, which uses a device kernel for the normalisation.
Run Nsight Systems on this program to see how the two versions perform.
Data lifetime exercise discussion
Data lifetime exercise timing table
 ** CUDA GPU Kernel Summary (cuda_gpu_kern_sum):

 Time (%)  Total Time (ns)  Instances  Avg (ns)   Med (ns)   Min (ns)  Max (ns)  StdDev (ns)                Name
 --------  ---------------  ---------  ---------  ---------  --------  --------  -----------  ------------------------------------
     95.6        2,000,548          8  250,068.5  249,601.0   227,873   271,585     21,636.6  void regular_fft_factor<...>  (cuFFT)
      4.4           92,896          1   92,896.0   92,896.0    92,896    92,896          0.0  normalise(double2 *, double, int)
** CUDA GPU MemOps Summary (by Time) (cuda_gpu_mem_time_sum):
Time (%) Total Time (ns) Count Avg (ns) Med (ns) Min (ns) Max (ns) StdDev (ns) Operation
-------- --------------- ----- ----------- ----------- --------- --------- ----------- ----------------------------
58.2 21,262,050 6 3,543,675.0 3,674,118.0 1,824 8,871,150 3,448,662.2 [CUDA memcpy Host-to-Device]
41.8 15,252,761 3 5,084,253.7 5,084,104.0 5,083,945 5,084,712 404.8 [CUDA memcpy Device-to-Host]Sometimes it is better to leave data resident on the GPU than to move it back to the CPU, where calculations might naively be more efficient.
Data transfer takeaways
Putting everything we’ve learnt together about data transfers:
- Prefer fewer, larger transfers.
- Consider moving data over to the GPU earlier than needed if it can be added to another transfer.
- Sometimes inefficient GPU code will still save time over transferring back to the host.
Conclusions and takeaways
You should now have plenty of practical experience using both the Nsight Systems and Nsight Compute profilers!
They are valuable tools for optimising GPU codes, and should be used as part of your regular workflow when trying to extract performance from your programs.
REMEMBER!
- Maximise resource usage – not just occupancy!
- Reduce data transfers!
- Coalesce your memory!
- Design your memory and data structures to suit the GPU!
Recap on optimisation
Memory coalescence discussion
| Kernel | duration (us) |
|---|---|
row_sum_strided |
3280 |
row_sum_coalesced |
764 |
The coalesced accesses are substantially faster.
Takeaways:
- Best practice is to design data to run well on the GPU from the start.
- It might be useful to spend time/compute to repack data into coalesced objects.
- Deciding which strategy is optimal is where the profiling cycling comes into its own!
Branching exercise discussion
| Coherence_parameter | Runtime (us) |
|---|---|
| 1 (divergent warps) | 813 |
| 16 | 813 |
| 32 (coherent warps) | 418 |
Takeaways:
- With divergent threads in the warp, the kernel runs each branch for every thread.
- When our warps coherently choose the same branch, we only need to run one of the branches, and our run time is halved.
- We can leverage this in the design of data structures and control paths, e.g. grouping boundary conditions together.
Grouped transfers I
Making one large transfer is more efficient than making many, smaller transfers.
Grouped transfers II
Using the sqlite functionality of Systems we can produce a table that calculates the transfer overheads:
| bytes | calls | api (ns) | gpu (ns) | overhead (ns) |
|---|---|---|---|---|
| 128000 | 1000 | 27835646 | 13919100 | 13916546 |
| 1280000 | 100 | 11496019 | 10038196 | 1457823 |
| 12800000 | 10 | 9811789 | 9649268 | 162521 |
| 128000000 | 1 | 9663991 | 9612501 | 51490 |
Remember!
- The same overheads will also happen when launching kernels.
- Launching many small transfers (or kernels!) in a loop is a very good way to run into large overheads, slowing down your code!
Data lifetime
Because data transfers are very time-expensive, it is good practice to leave memory on the GPU for as long as possible.
Sometimes, this means creating kernels for code that could be better optimised on CPU but is part of the way through a GPU workflow. The inefficient calculations on GPU might still be faster than a transfer to and from the host!
Data transfer takeaways
Putting everything we’ve learnt together about data transfers:
- Prefer fewer, larger transfers.
- Consider moving data over to the GPU earlier than needed if it can be added to another transfer.
- Sometimes inefficient GPU code will still save time over transferring back to the host.